Vehicle and pedestrian statistics are collected at every timestep of the simulation, and the aggregate results are written to text files. When the simulation is completed, these files are created in a folder that bears the date and timestamp, located under the Output folder (which is inside the model folder). Four files are generated as shown below (for a model named ‘Pedestrian High Flow Area’):
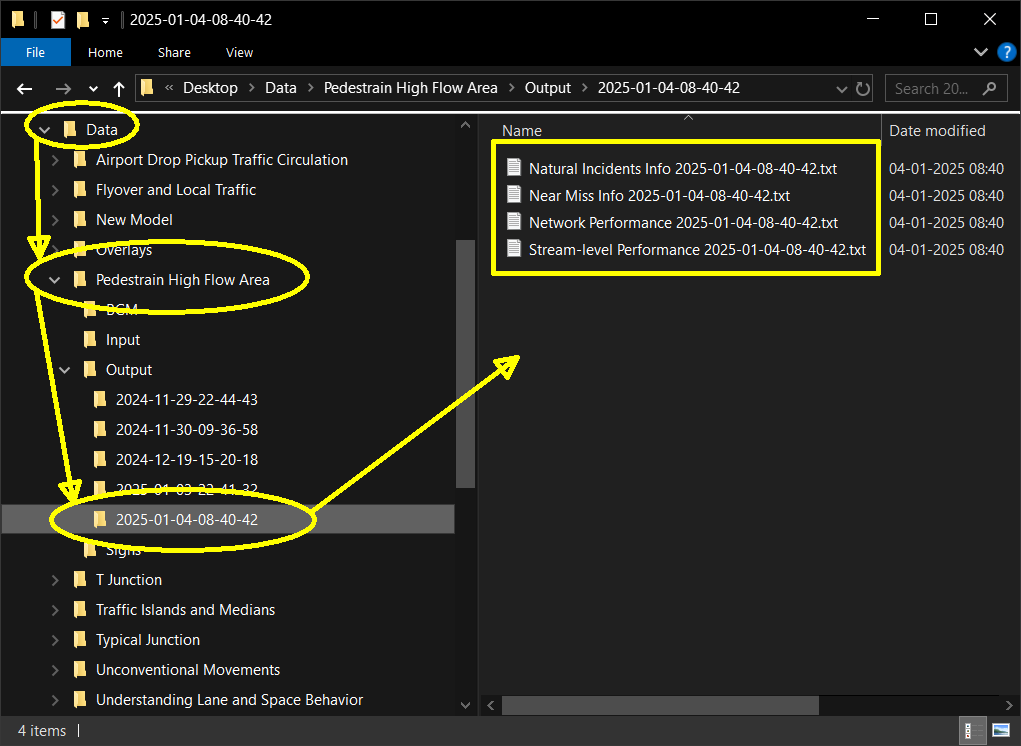
Location of the output files in the model folder.
The file named “Network Performance xxxx.txt” provides an overall performance summary of the layout-flow-control combination for the current scenario being modeled. The file contents appear as shown below:
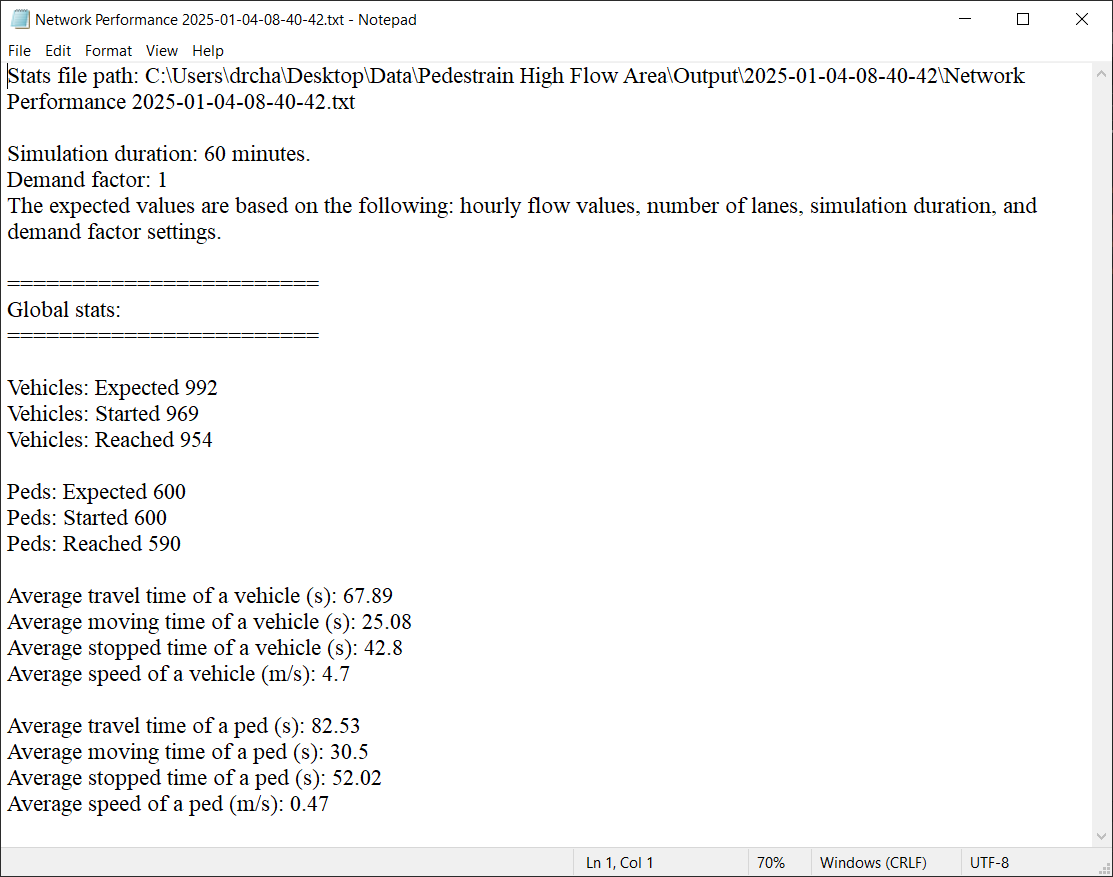
Global statistics output file.
The above screenshot is an example of the text file. The data can be copied into platforms like spreadsheets (e.g., Excel) or analyzed using software such as R. The file begins with key input data like simulation duration and demand factor. It then reports the number of expected, started (released into the network), and reached (completed the journey) vehicles and pedestrians.
The reported data appears acceptable in this example. The expected vehicle count is close to the number of vehicles simulated (started), and pedestrian flow matches expected values closely. If there is a significant difference between expected and started vehicle counts, it may indicate that the inputs are too high for the capacity of the junction or network modeled. In such cases, adjustments to the layout or control strategies can be made to meet the target. Alternatively, the field data used for model inputs (flow and speed data for streams) should be verified for realism.
This global statistics file includes data on travel time, stopped time, and vehicle speeds (reported in meters per second). These variables are useful for comparing the performance of different scenarios involving control strategies and layout configurations.
The file named “Stream-level Performance xxxx.txt” provides detailed data on vehicle release and trip completion for each stream. This information can help identify streams that are performing well or underperforming. An example of the file contents is shown below:
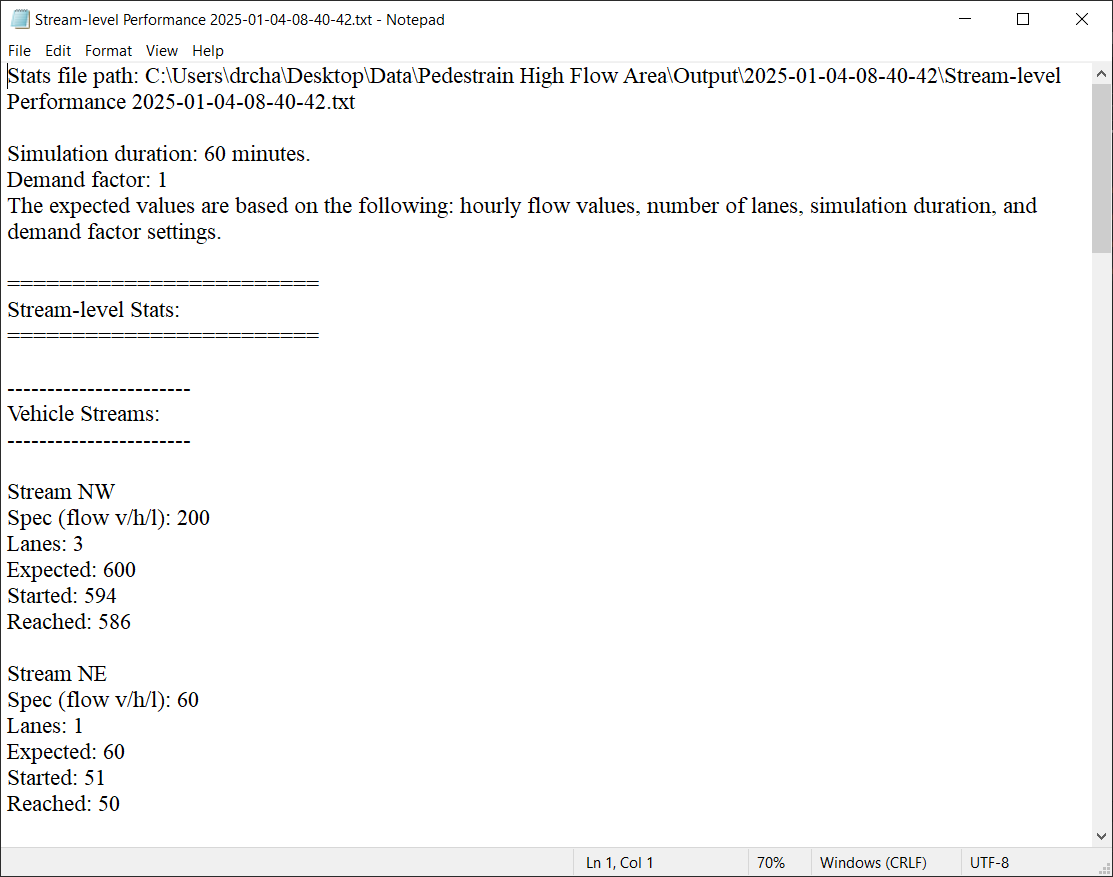
Stream-level vehicle counts output file.
The file named “Near Miss Info xxxx.txt” lists all near misses that occurred during the simulation period. The file contents are illustrated below:
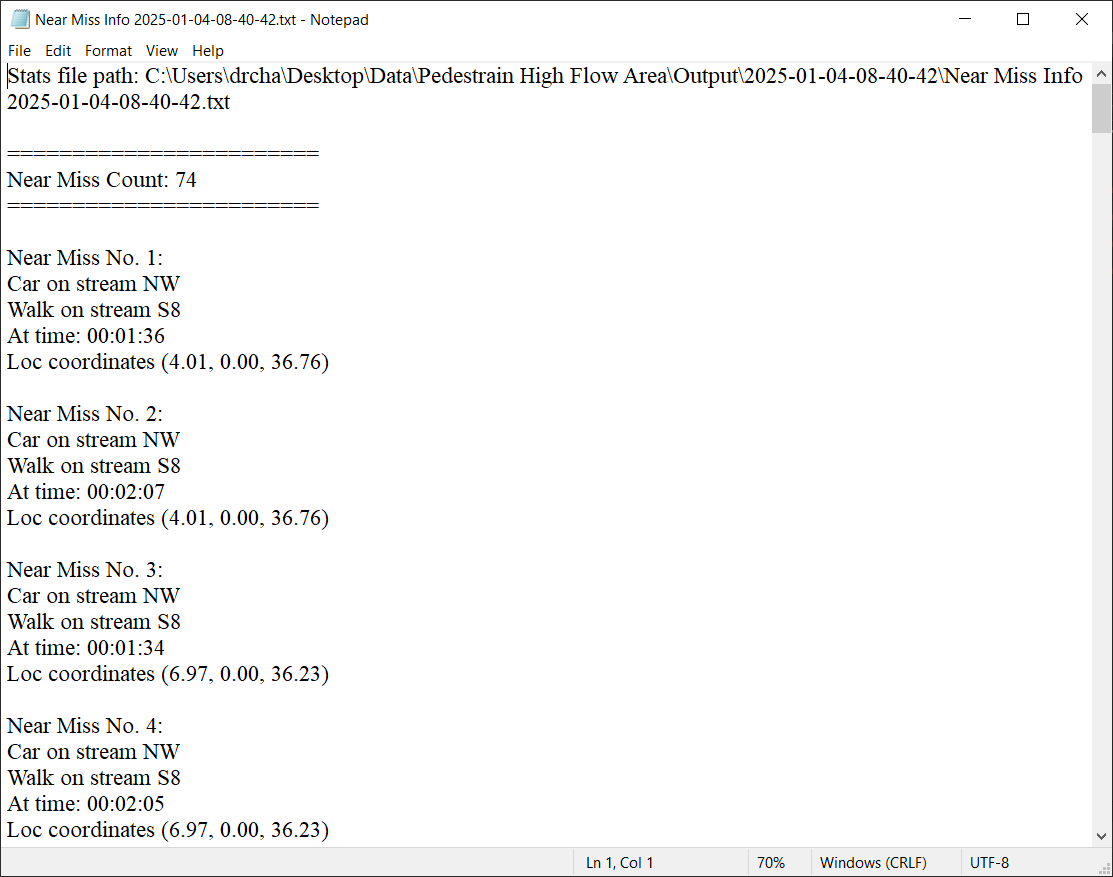
Near miss information. Includes vehicles involved, streams, time, and location.
The file named “Natural Incidents Info xxxx.txt” lists all incidents that occurred during the simulation period. Below is an example of the file contents from a model where an incident occurred:
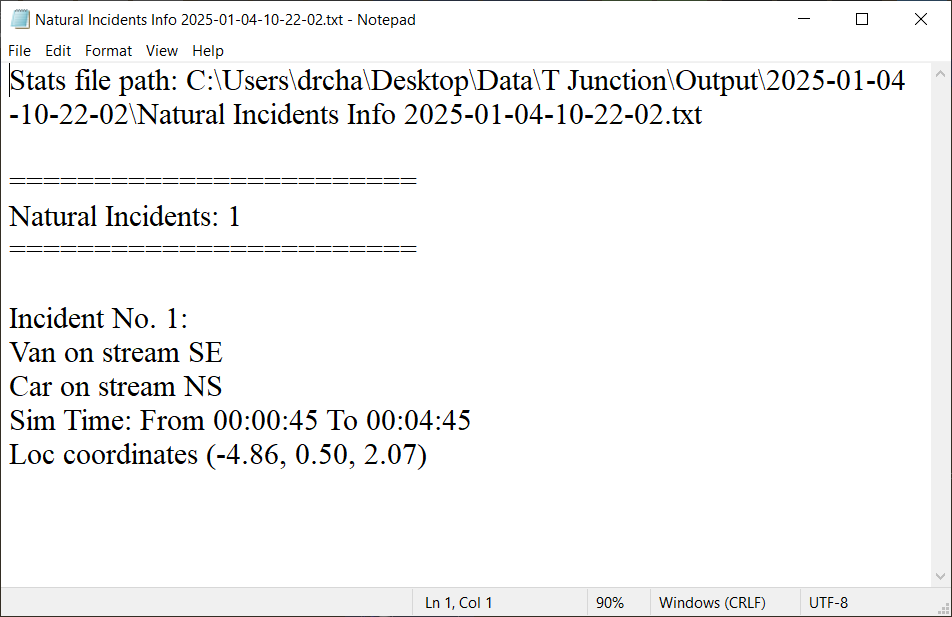
Incident information includes details of vehicles involved, streams, duration for clearance, and location.